The discrete GPU landscape has witnessed dramatic shifts over the past decade and a half. From NVIDIA’s commanding lead to AMD’s strategic comebacks to Intel’s recent entry, the competitive landscape continues to evolve at a rapid pace. This comprehensive analysis tracks the market share fluctuations between these tech giants, examining the factors driving these changes and what they mean for consumers, gamers, and investors alike.
Unlike integrated graphics solutions built into CPUs, discrete GPUs are separate components that deliver superior graphics performance for everything from gaming desktops to professional workstations. Understanding market share trends gives us insight into the health of competition, pricing dynamics, and the pace of technological advancements.
Annual Market Share Analysis (2010-2024)
The last fourteen years tell a fascinating story of competition, innovation, and strategic maneuvers in the discrete GPU market. Let’s break down the journey quarter by quarter, focusing on the actual percentages and the key events that reshaped the industry.
The Early 2010s: A More Balanced Duopoly
In 2010, NVIDIA and AMD were much closer competitors than they are today:
| Year | Quarter | NVIDIA Market Share | AMD Market Share |
| 2010 | Q1 | 58.4% | 41.6% |
| 2010 | Q4 | 59.3% | 40.7% |
| 2011 | Q2 | 60.1% | 39.9% |
| 2012 | Q1 | 64.5% | 35.5% |
During this period, AMD was a formidable challenger with its Radeon HD 5000 and 6000 series competing against NVIDIA’s GeForce 400 and 500 series. The competition in gaming graphics was particularly fierce, with each company leap-frogging the other with regular product releases.
“The early 2010s represented perhaps the healthiest period of competition in the modern discrete GPU era, with genuine innovation coming from both camps.” – Jon Peddie Research (JPR) Analyst
2013-2016: NVIDIA’s Ascendancy Begins
The mid-2010s marked a turning point in the competitive landscape:
| Year | Quarter | NVIDIA Market Share | AMD Market Share |
| 2013 | Q4 | 65.2% | 34.8% |
| 2014 | Q3 | 70.3% | 29.7% |
| 2015 | Q2 | 76.4% | 23.6% |
| 2016 | Q1 | 78.1% | 21.9% |
The GeForce GTX 900 series launch in 2014 proved to be a watershed moment. These Maxwell architecture cards delivered unprecedented power efficiency and performance benchmarks that AMD struggled to match. This period coincided with AMD’s focus shifting somewhat to CPU development with their Ryzen architecture.
2017-2020: The Mining Boom and Pandemic Effects
This period saw extraordinary market forces at play:
| Year | Quarter | NVIDIA Market Share | AMD Market Share |
| 2017 | Q3 | 72.8% | 27.2% |
| 2018 | Q1 | 68.3% | 31.7% |
| 2019 | Q2 | 77.2% | 22.8% |
| 2020 | Q4 | 82.1% | 17.9% |
The cryptocurrency mining boom of 2017-2018 significantly disrupted the market trends, benefiting AMD disproportionately before the inevitable crash. Then, the pandemic created unprecedented demand for gaming hardware as people sought entertainment during lockdowns. NVIDIA’s superior supply chain management during this period allowed them to capitalize more effectively on the surge in demand for gaming laptops and desktops.
Research and development investments during this period were critical, with NVIDIA pouring resources into ray tracing and artificial intelligence (AI) capabilities that would later prove decisive in maintaining market dominance.
2021-2024: The Rise of AI and Intel’s Entry
The most recent period brings new dimensions to the competition:
| Year | Quarter | NVIDIA Market Share | AMD Market Share | Intel Market Share |
| 2021 | Q2 | 83.4% | 16.6% | 0% |
| 2022 | Q1 | 81.2% | 18.3% | 0.5% |
| 2023 | Q3 | 79.6% | 18.8% | 1.6% |
| 2024 | Q1 | 78.1% | 19.3% | 2.6% |
The explosion of artificial intelligence (AI) and machine learning (ML) applications has created an entirely new battleground. NVIDIA’s early investments in these technologies have paid enormous dividends, allowing them to maintain their substantial lead despite AMD’s renewed competitiveness in pure gaming performance with their RDNA architecture.
Intel’s entry with Arc GPUs in 2022 marked the end of the decades-long duopoly, though their impact remains modest in these early stages.
The Duopoly Era: NVIDIA vs. AMD (2010-2021)

Before Intel’s entry, the discrete GPU market was defined by the NVIDIA-AMD relationship across various segments and price tiers.
Market Segment Analysis
Different market segments showed varying competitive dynamics:
Gaming Segment
- High-End (>$500): NVIDIA dominated with 85-90% share through most of the period
- Mid-Range ($250-$500): More competitive, with NVIDIA averaging 70-75% share
- Budget (<$250): Closest competition, with AMD occasionally taking the lead in 2016-2017
Professional Segment
The workstation market saw even greater NVIDIA dominance:
| Year | NVIDIA Workstation Share | AMD Workstation Share |
| 2010 | 77% | 23% |
| 2015 | 85% | 15% |
| 2020 | 92% | 8% |
NVIDIA’s Quadro series established itself as the gold standard for professional graphics work, with superior driver stability and software certification.
Data Center Segment
The emergence of machine learning (ML) transformed this segment entirely:
- 2010: Roughly split market, with specialized applications
- 2015: NVIDIA at 65%, AMD at 35% as CUDA gained adoption
- 2020: NVIDIA at 90%+, AMD below 10% as AI accelerated
The development of CUDA as a machine learning platform proved to be perhaps NVIDIA’s most strategic innovation, creating an ecosystem that competitors struggled to match.
Regional Market Share Differences
Competition varied significantly by region:
- North America: Strongest NVIDIA presence (averaging 5-8% higher than global)
- Europe: Slightly more balanced, especially in Eastern Europe
- Asia-Pacific: AMD’s strongest region, particularly in China and India
- Japan: Unique market with NVIDIA at >90% share throughout most of the period
These regional differences reflected varying priorities in gaming graphics, price sensitivity, and historical brand relationships.
The New Challenger: NVIDIA vs. AMD vs. Intel (2022-2024)

Intel’s entry into the discrete GPU market marks one of the most significant shifts in the industry’s competitive structure in decades.
Intel Arc’s Initial Impact
Intel’s first-generation Arc GPUs faced several challenges:
- Driver stability issues limited initial adoption
- Manufacturing delays pushed back widespread availability
- Limited product range focused on mid and entry-level segments
Despite these hurdles, Intel captured approximately 2.6% market share by Q1 2024, primarily at the expense of NVIDIA rather than AMD. This suggests Intel positioned its products more directly against NVIDIA’s offerings as well as dell.
Competitive Response
Both established players adapted their strategies in response to Intel’s entry:
NVIDIA’s Response:
- Increased focus on the high-end segment where Intel couldn’t yet compete
- Enhanced performance benchmarks in the mid-range to maintain leadership
- Leveraged their superior machine learning and AI capabilities
AMD’s Response:
- Aggressive pricing in budget and mid-range segments
- Emphasized their advantage in power efficiency
- Expanded their FSR (FidelityFX Super Resolution) support to compete with NVIDIA’s DLSS
Segment-Specific Impact
Intel’s initial impact varied considerably by segment:
- Gaming Laptops: Most successful entry point, reaching ~4% share
- Gaming Desktops: Limited to ~1.5% share, primarily in budget builds
- Workstations: Negligible presence (<0.5%)
- Data Center: Focused on future architectures rather than current competition
Behind the Numbers: What Drives Market Share Shifts
Several critical factors have determined the ebbs and flows of GPU market shares over the years.
Technology Leadership Cycles
The history of the discrete GPU market is fundamentally a story of technological leapfrogging:
- 2010-2013: Relatively balanced innovation cycles
- 2014-2017: NVIDIA’s Maxwell and Pascal architectures created a significant lead
- 2018-2020: AMD’s RDNA architecture began closing the gap
- 2021-2024: NVIDIA’s advantage in AI and ray tracing created new differentiation
“The company that wins in graphics performance isn’t necessarily the one with the highest frame rates, but the one that correctly anticipates the next critical technology frontier.” – Statista Industry Analyst
Manufacturing Process Advantages
Access to advanced manufacturing nodes has been a decisive factor:
- 2016: NVIDIA’s early transition to 16nm while AMD remained on 28nm
- 2019: AMD’s shift to 7nm before NVIDIA
- 2022-2024: Competitive manufacturing as both accessed similar nodes
These transitions directly impacted power efficiency, performance, and ultimately, market share.
Software Ecosystem Development
Perhaps the most underappreciated factor in market trends has been software:
- NVIDIA’s CUDA platform created an insurmountable advantage in machine learning (ML) applications
- GeForce Experience streamlined the gaming experience
- DLSS (Deep Learning Super Sampling) established a clear visual fidelity advantage
- AMD’s open-source approach with FSR and ROCm gained traction but couldn’t fully bridge the gap
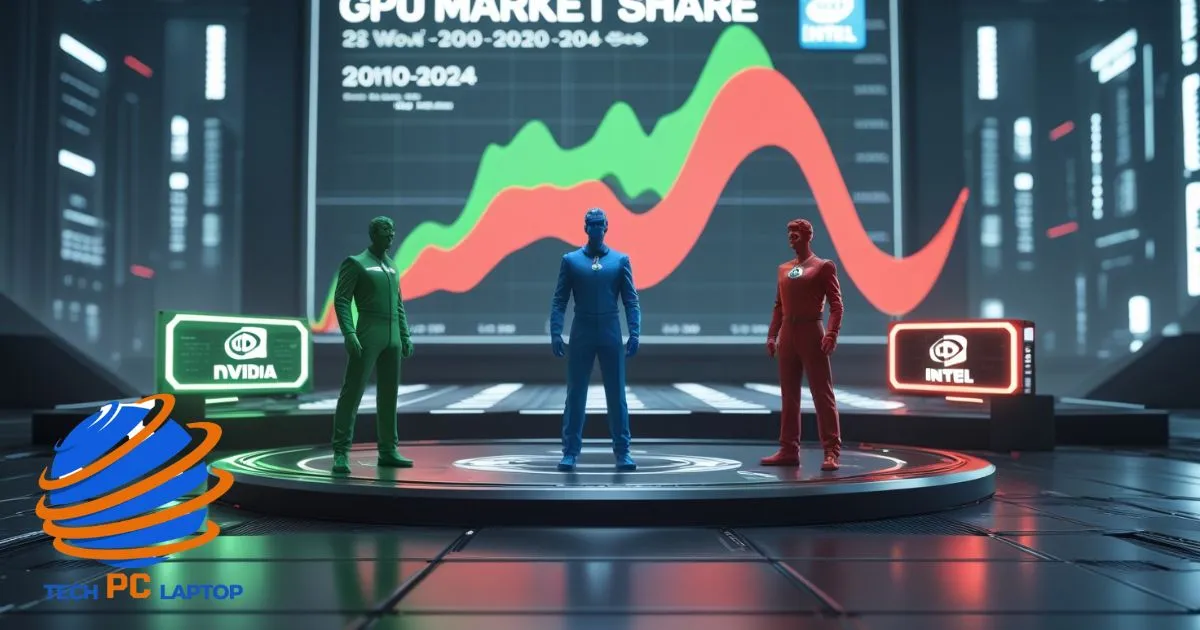
Visual Breakdown of Market Trends
Quarterly Market Share Evolution (2010-2024)
This chart illustrates several key periods:
- The relatively stable competition of early 2010s
- NVIDIA’s ascendance from 2014-2017
- The mining boom’s temporary boost to AMD
- NVIDIA’s AI-driven dominance from 2018 onward
- Intel’s modest but growing presence since 2022
Price Tier Distribution (2024)
| Price Tier | NVIDIA | AMD | Intel |
| Ultra ($1000+) | 92% | 8% | 0% |
| High ($600-$999) | 85% | 15% | 0% |
| Medium ($300-$599) | 76% | 19% | 5% |
| Budget ($100-$299) | 70% | 23% | 7% |
| Entry (<$100) | 64% | 28% | 8% |
This data reveals how Intel has primarily focused on the lower tiers while NVIDIA maintains an overwhelming advantage in premium segments.
Expert Analysis: Future Market Share Predictions
Industry analysts provide varying perspectives on where the market is headed in the next 24-36 months.
Consensus Forecast for 2025-2026
| Company | End of 2025 | End of 2026 |
| NVIDIA | 75-77% | 72-75% |
| AMD | 20-22% | 21-23% |
| Intel | 3-5% | 4-7% |
These projections reflect several key assumptions:
- Intel’s continued improvement in driver stability
- AMD’s gains in gaming graphics performance
- NVIDIA’s sustained leadership in artificial intelligence (AI)
Technology Roadmap Implications
Upcoming architectural changes will significantly impact market share:
- NVIDIA’s Blackwell architecture promises substantial gains in AI computing
- AMD’s RDNA 4 aims to close the ray tracing performance gap
- Intel’s Battlemage architecture targets mid-range performance parity
The consensus view suggests NVIDIA will maintain leadership in emerging technological advancements while facing increased pressure in traditional gaming segments.
Emerging Market Factors
Several new developments could reshape the competitive landscape:
- Cloud Gaming: Potentially reducing the importance of discrete hardware
- AI PCs: Creating new requirements for local AI processing
- AR/VR: Establishing new performance metrics beyond traditional graphics performance
- Professional Visualization: Growing emphasis on real-time rendering for design
These factors introduce significant uncertainty into long-term market predictions.
The Consumer Perspective: How Market Share Affects You

The competitive dynamics of the discrete GPU market directly impact consumer experience in multiple ways.
Price Competition Correlation
Historical data shows an interesting relationship between competition and pricing:
- 2010-2014: When AMD held 35-40% share, price-per-performance improved ~15% annually
- 2015-2018: As NVIDIA’s share exceeded 75%, price-per-performance improvements slowed to ~8% annually
- 2019-2022: Mining boom and pandemic supply issues led to price increases despite technological advances
- 2023-2024: Return to price competition with Intel’s entry
This pattern underscores why market share matters beyond business metrics—it directly affects affordability.
Innovation Pace
Competition has consistently accelerated technological advancements:
Areas with Strong Competition:
- Rasterization performance: 15-20% improvement per generation
- Memory bandwidth: Regular architecture upgrades
- Feature support: Rapid adoption across vendors
Areas with Limited Competition:
- Ray tracing: Slower pace of optimization by AMD
- AI acceleration: Minimal pressure on NVIDIA to improve cost efficiency
- Driver optimization: Less urgency without performance parity
Product Availability Patterns
Market share directly affects product availability at various price points:
- NVIDIA: Consistent releases across all tiers, often with extended gaps between generations
- AMD: Focused releases targeting specific segments, sometimes leaving gaps in their lineup
- Intel: Limited initial offerings with gradual expansion
For consumers, this means options vary significantly by budget, with the most consistent choice at premium tiers but more variability in mid and budget ranges.
Conclusion: Market Health and Competition Outlook
The discrete GPU market continues to evolve, though NVIDIA’s position remains formidable.
Key Market Trends to Watch
- AI’s Growing Importance: The increasing significance of AI capabilities in both consumer and professional GPUs
- Intel’s Trajectory: Whether they can establish a sustainable position beyond 5% share
- AMD’s Strategy: Their balance between CPU and GPU investment
- Manufacturing Parity: Access to advanced nodes as a competitive equalizer
- Software Ecosystems: The growing importance of platform lock-in beyond raw hardware performance
Indicators of Healthy Competition
Several metrics suggest the market is becoming more competitive despite NVIDIA’s continued dominance:
- Price competition has intensified since 2022
- Feature adoption cycles have accelerated
- Mid-range performance improvements have outpaced premium segments
- Software support has improved across vendors
“The entry of Intel creates a fundamentally different competitive landscape than we’ve seen in the past twenty years. While NVIDIA’s lead remains substantial, the three-player market creates new competitive dynamics that will ultimately benefit consumers.” – Yahoo Finance Technology Analyst